Matt Dunie
Editor’s Note: This article was originally published in eContent Quarterly (June 2014).
Libraries spend millions of dollars to purchase huge amounts of content and sophisticated technology to fulfill their mission. Some deal with hundreds of vendors every year, others with only a few. All of these vendors are crucial to positive user experiences of library content and services. But the scale of library scope and budget does not necessarily impact the efficiency of the vendor negotiation process. This article examines the need for a more documented negotiation process, with specific review points and measurement concepts illustrating the opportunities in making vendor negotiations yield more value for the library organization. We will examine some of the economic value components and motivations from the vendor side of the negotiation process and how those drivers impact customers’ buying patterns but may also lead to opportunities. In addition, we will explore and explain at a high level some of the business models vendors employ and how they may impact sale price and, in turn, purchasing behavior. The article will take a “commercial approach” to the purchasing of library-oriented content and technology. It will examine business models, components of negotiations for content or technology, commercial drivers, and economic value arguments that are part of every negotiation but not always recognized. My opinions are based on more than two decades of experience in the information industry as a line employee, senior executive, manager, and founder of various information and technology businesses.
Before we get into details about the business side, it is important to work from a common vocabulary. While the library and the vendor segments are more collaborative than many industry markets, the vernacular used internally is not necessarily common. Throughout the article, there are terms that are standard commercial lingo, but not always standard in this customer base. In the interest of “speaking the same language,” let’s define some terms for the purpose of this article:
There are several environmental points of reference we must use:
Let’s look at some of details behind these statements. According to the Department of Education Academic Libraries Survey, expenditures for information resources continue to rise, growing 7 percent from the 2008 to 2010 academic years. In fact, most categories of electronic materials showed modest increases from the previous period. Imagine the joy that brings to publishers of business planning processes. And expenditures for bibliographic utilities, networks, and consortia also increased by 4 percent, again reason for excitement if you are in any of those businesses or provide products and technology through those mechanisms.
But something about these numbers does not mesh with what we hear in the marketplace. The anecdotal evidence suggests that budgets have been under severe pressure. Customers tell us: “If I want to add something to my collection, I have to figure out what has to be discontinued.” If you are selling technology products targeted toward libraries, you would have found the market to be especially tight; budget dollars for expenditures for computer hardware were down just over 10 percent from the previous reporting period. But there is a big push in this category and new product announcements all the time. And this is a mature segment, almost fully saturated as total expenditures for academic libraries have flattened since 2008, showing literally no growth. As table 3.1 shows, there was less than ½ of 1 percent growth from 2008 to 2010, and under 3 percent growth from 2010 to 2012. If we were to assume that prices increased over the same period equal to the rate of inflation, the total expenditures would actually be a decline in buying power of almost 6 percent.
How are content and technology being paid for? Simple: other spending categories are down. Among the categories that have declined since 2008: number of branches, number of librarians, number of paid staff, expenditures for preservation, and so on. Table 3.2 shows a sampling of line item reductions.
Yet, even during severe economic periods, libraries continued to acquire content at similar rates as they did in previous years. Some content categories grew tremendously while the growth in others declined. Generally, year in and year out, libraries increase their collections by some amount. In recent years there have been large increases in acquisitions of e-books, for example.
If we were to work on the top line numbers alone, this industry appears to be stable and mature. Even during periods of great financial turmoil, the industry maintained a similar growth rate as in previous years, probably due to the advent of the print-to-digital and then digital-first content production impact. When you dig deeper into the numbers, you will find that some categories of new content acquisition have declined significantly, and they have been replaced by other categories—more varied offerings of digital content. The shift to digital content has been obvious for more than twenty years, but it is continuing in new media types, such as audiovisual content and raw data. But the business terms for new forms and formats of content and the expertise necessary to negotiate the requisite contracts must evolve as well. Content delivered in multiple formats, via multiple technology platforms, which enable broader access, are licensed under different business models that are evolving constantly. For example, when a library acquires perpetual access rights to a content collection, are there specific technology rights that must be negotiated? What is the business model that is used to determine the real value of the sale to the provider and the customer? Perhaps there is a technology company which acts as a third party for distribution and maintenance of the content. Or a third-party escrow holder for computer code and/or content. How are these items considered in the acquisitions process, or documented in the contract?
The market is much more complex than the top line numbers make it appear. It is a collegial and mission-driven marketplace where the customers must be able to adapt quickly to changing terms and new business requirements on an ever-expanding product base with few staff. Why not use the same tools and strategies the vendors use? The additional effectiveness in negotiations will result in greater competition, new product categories, and more innovative solutions for the customer base as well as growth opportunities for the vendors.
The end result of any negotiation with vendors is a contract, license, or agreement for products or services and delivery of the same. As the industry has migrated to more technologically involved and curated content offerings, product business models changed, and clarity in pricing has become more infrequent. In fact, I would suggest that some pricing philosophies are more opaque intentionally. Yes, there are “price lists,” but there are also “price calculators,” intricate spreadsheets with multitudes of options with which salespeople must confer in order to develop a price proposal for a more complex offering. And when customers purchase as a consortium or through a buying group, vendors have a need to customize price modeling based on a myriad of factors.
Price can be determined by the producer in a number of ways, but generally, it depends upon a few components: product cost, labor, cost of promotion/sales, target margin contribution. In the information industry, these items may look similar to the lists in table 3.3.
While the cost structures in the information industry may look like most any business, there are some unique attributes to this industry, whether print or electronic:
Similarly, certain costs go down as the business grows. There are many different types of royalties and royalty calculations: fixed royalty, minimum guarantee, unlimited rights, usage based, and so on. Let’s examine a simple royalty structure for a content product. We will call it a fixed price royalty: An agreement is made to pay an annual fee (or a one-time fee) for the rights to the content regardless of revenue associated with the product. In this case, as product sales amass, the royalty stays fixed, and no matter what the sales are for a particular product, the royalty will be fixed. In this case, we will use a number of $10,000, per annum. And we will assume the product sales grow quickly, from zero to $250,000 over five years (see figure 3.2).
If the royalty is not fixed, but variable based on a sales percentage, the chart would look different (see figure 3.3).
In either case, the vendor has a lot of margin to use in paying the other costs of the product, but also, very different profit opportunities. Similarly, a recurring revenue product builds in value for the provider, and product costs are lower for renewal in many categories. Costs that are reduced on renewals include cost of sales, incremental cost of development, distribution commissions, and incremental cost of distribution technology.
Businesses do much research and make projections based on market analysis, product costs, and the like. Included in those projections are target profit metrics they look to achieve, along with revenue objectives for each component in their product mix. Various price analyses are considered to arrive at a price the company believes the market will pay for its products.
There are lots of economic models vendors can present. Below are some that are popular:
For the purpose of this discussion, we will concentrate on recurring revenue and one-time purchase models.
There is no secret that recurring revenue can be a powerful force.
Assumption: product selling price is $1,000 per year, with a 90 percent renewal rate and a 5 percent price increase.
The customer looks at this as a $1,000 serial commitment, and may budget a price increase from year to year. It might look like table 3.4.
But the company looks at it a little differently. The vendor looks at this opportunity in terms of the product’s total customer base. Table 3.5 shows several of the other factors a company takes into consideration relative to price. Thus, while a single customer may look at the product as a $1,000 annual obligation in the beginning, the vendor looks at this example as $50,000 initial product line revenue with the potential of generating more than $300,000 in the seventh year.
A company selling a product for a price, say $1,000, which renews every year, is very different from a single purchase of $1,000. But, since the costs are lower for renewal sales than new sales, the out years are much more profitable than the first year for the company. And when you add a modest price increase every year (in some cases not so modest), then the $1,000 sale can become a sale valued at more than $12,500 if renewed for nine years. This works the same for content products or technology products. However, technology products have differing recurring revenue calculations. Namely, there may be a premium charge on the first year with a ~20 percent annual maintenance fee on the out years.
The one-time purchase/maintenance model works exactly the same as above. However, the purchase/maintenance model is a little different. It may be less costly to the customer over time than the annual subscription model, but the company must depend on a longer product life cycle and greater annual sales volume or a much higher initial sales price to make up the difference. The solution to this is to add new modules that fall outside the purview of maintenance.
When the vendor adds a new module, it becomes part of the product, but for an additional cost . . . and then may or may not add onto the annual maintenance cost of the product as a whole.
When negotiating for content or technology products with vendors, it is important to understand their business models in order to negotiate effectively. Otherwise, you are negotiating against an unknown target, and price quotes are meaningless, as are the discounts offered in an indefensible price quotation.
A one-time purchase agreement where no additional modules are projected can be a great deal. Generally, the company will multiply the annual license price by five to arrive at the perpetual rights price. In addition, there may be an annual “access” fee that is required to enable access to the content. This model works well until the time comes where the aggregate “access fees” add up to the equivalent of the annual lease or until a new module of the product becomes available and it is another 5x premium on the base price (see table 3.6).
What is frequently overlooked in this negotiation are the technical details of the content and the customer’s rights with regard to accessing the content under the terms of the license. Perhaps the customer wants to have a third-party technology partner load the content on a hosted platform and manage access on behalf of the customer. And to load that content on any platform of their choice. After all, the customer has paid for perpetual access rights to the content. In reality, some vendors place restrictions on this opportunity to preserve their technical interaction with the customer. Or maybe the customer did not ask for the source code, or content to be placed in a third-party repository or held in escrow, in the event there is a liquidation or the vendor’s systems are destroyed for some reason.
One-time purchase negotiations may be easier than annual licenses, but the final agreement does not always contemplate long-term access, escrows, multiple platform access, editorial or content fixes, or other items that may be important to different customers.
Now that we know more about the company’s cost structure, we can start negotiating. When a customer is buying anything, it is making a purchase decision based on a number of variables: budget availability, need, constituent pressure, relationships with vendors, and so on.
The library is a mission-centric organization, whereas the business is a financial-centric organization. Regardless of the company mission statements and tag lines, tax status, or otherwise, it is in business for financial reasons. It has financial goals and objectives as well as other “soft” objectives which cannot be met without first achieving the financial requirements of the business.
The ground rules, thus, are as follows:
The sheer number of products and services offered to the library market is staggering. In addition to external organizations, libraries must also deal with internal organizations: government entities, shared service vendors, facilities departments, administration, political positions, development partners, and various other constituencies.
Vendors spend huge amounts on training and educating their sales staffs on negotiation skills. In recent research I have done, I learned that libraries rarely spend much, if anything, on negotiation skills for their staff. Yet, they are tasked with managing millions of dollars for product acquisition, technology implementation, outreach, and community engagement and instruction.
According to an article in the Journal of Personal Selling and Sales Management from 1996, companies spend tens of thousands of dollars training and educating each member of their sales staff (Dubinsky, Alan J. “Some Assumptions about the Effectiveness of Sales Training.” The Journal of Personal Selling and Sales Management [1996]: 67–76).
Companies also use sophisticated software to track all interactions with customers and prospects. This software tracks contact names, product interests, notes, e-mails; almost every communication between customers and the company can be entered into the system. In fact, vendors spend time and money on sales training, systems, and modeling before they ever make a presentation to a customer.
All of this expertise and expense in training commercial staff can be countered to some extent by implementing a few concepts into regular product acquisitions workflow. In the end, a more effective negotiation will ultimately help all parties involved. Customers will be able to acquire more products and services in pursuit of their mission and vendors will be able to find customers for new products and services. Also, due to the increased complexity and size of library collections over the past decade, more process may make it more manageable for the smaller staff size to handle the increase in collection size.
Objectives, timetables, team, and strategy are the four items that should be part of any planned negotiation:
The team is important. And the team has multiple members. It doesn’t matter if you are a large or small organization. There can be multiple teams, but the roles are going to be similar. And the team players can use each other at different points in the negotiation process. Team members include functional responsibilities:
Everybody on the team has a role, but not everybody must attend every vendor meeting. The key to the team is to delegate and utilize expertise at the appropriate time. The key to utilizing the team is to keep the members abreast as to the status of the negotiation or project, so that everyone is working in sync with counterparts on the vendor side. Yes, the vendors also have the same team members; it is just that they are typically represented by one or two vendor representatives. Rest assured, they have the same expertise in their organization guiding their customer-facing staff.
Vendors routinely review customer negotiations. Some vendors will have sales manager reviews weekly or monthly. Some may have “major opportunity” reviews, which go into more detail on larger sales opportunities. Therefore, customers can have the same type of review system in place. Status checks are taken on important negotiations and product acquisitions. These reviews need not last a long time, but they should be prioritized in order of importance.
Regardless of budget cycles, negotiations can take place throughout the year. The year should be defined by the customer’s calendar. Vendors love to make “end of year” offers. They may be great deals and may be good for the customer, but more often than not they are based on the vendor’s financial calendar, rather than that of the customer.
Objectives must be documented, but they need not be overly complex. In fact, the simpler they are, the better. In addition, they must be measureable. For example, if you are negotiating an SaaS product acquisition, you may want to quantify the value components of the product in terms that every member of your team can relate to easily: For example, customer objectives could be:
Each of these items can be quantified in simple ways so the entire team can view their individual analysis and detail negotiations within a common frame of reference (see table 3.7).
Meanwhile, customers must assume the vendor has a set of documented objectives as well. A simplistic overview of vendor objectives:
Again, these can be quantified as shown in table 3.8.
Given that you now have both your objectives documented and an assumption about the vendors’ objectives, you can create a one-page document that provides a targeted list of items you will negotiate for, with a reasonable chance of success:
There is a lot of detail behind the simple list, but much of that is dealt with separately. If these items are met and agreed to, both the customer and the vendor will have an equitable relationship, which will in turn engender more business between them in the future and support both the brand image of the vendor and the satisfaction of the libraries’ user base.
No surprise here, everything has to be managed against the calendar. (See figure 3.4.) There is no specific time interval in this figure, but certain components of product negotiation happen at different times. It may not appear as obvious or straight-line as this figure indicates, but the objective is to create a calendar that works for the library relative to negotiations. Note that negotiations can be run independent of product and budget reviews. There is no rule of thumb on this, although most managers like to keep them independent, but information collected during one part of the process informs other parts of the process.
Notice where “Price” appears in the process—not in the beginning. The first time you ask for price, you start negotiating on price. Salespeople are trained to recognize this as a “buying signal.” Price is based on several factors; simply asking “what is the price?” is not the best way to get the value the product will bring to your organization, nor is it a good way to start a negotiation. A better way to phrase the question is: “How do you defend the price?”
Here we didn’t ask what the price is, nor did we start a pricing discussion. We simply wanted to know more about the cost structure of the product or service we are acquiring. Even so, it is better to hold this until the rest of the value components are identified and documented on your negotiation sheet. You also limit your ability to learn more about the product as the vendor becomes more focused on your pricing request. But you may need ballpark figures to put onto your “wish list” or “for evaluation” file.
Well-managed businesses have pricing objectives—that is, they establish a list of objectives the price component of their product is intended to support. For example, a short list of pricing objectives could be:
Items 1 and 2 would generate lower price points and minimize renewal rate increases. Item 3 may be a corporate policy and a management directive, and item 4 could be a requirement to help bring efficiency into the organization, which could in turn, lower the overall cost structure and provide both more profit and more value for customers.
Price defensibility is the ability to explain the makeup of the price, as opposed to a price quote. For example, when you ask for a price, if the answer is something along the lines of “Our price is an FTE-based price depending on the classification of your organization, or population served,” you have been given a price model, not a price defense. If the answer includes information about the product’s cost components, the added capabilities or content, the investment the company put into creating the product, or other items that actually describe the basis of the price, then the price quote is defensible.
In some instances, price defense is based on current exposure, sales projections among a group, or some unique trait or capability of the product or company or even a development partnership between the customer and the company.
There are many drivers of price and product—some obvious and others not so obvious—and all of which influence buying opportunities and buying behaviors.
There is a good chance the salesperson calling on the library is thinking of his or her compensation plan, or some other management metric that was put on their shoulders. Well-run companies use their salespeople to gather feedback from customers as well as to promote products and services.
One must recognize that price, on its own, is just a statement of value. When probing questions are asked about price during the negotiation, you will uncover drivers that can be disputed or accepted so long as they are defensible. Almost every driver to price can be quantified in one way or another.
In order to negotiate effectively, it is best to start with a defined goal or set of goals to use while negotiating with multiple vendors. In every case, one must define the situation. This is an easy thing to do, but different objectives may rise or fall in importance depending on the situation. For example, a long-term technology acquisition is very different from negotiating for a content aggregation. A simple overview document or negotiation sheet can be generated for all team members to share. This sheet should include the definition of the situation; simple is best. Possible types include new product, renewal, questionable renewal, development partnership, major technology acquisition, minor technology acquisition, and consulting services.
For each of the items on the list, high-level imperatives can be documented. This can be simply documenting directives to be shared among the team: reduce spending in this category by 2 percent; limit renewal increase for 3 years to 5 percent per annum; negotiate source code escrow deposit; or negotiate multiple platform access and secure data delivery for perpetual rights access. Even if you are not successful in achieving a positive result on all of the items, you provide leverage in the process by raising all of the questions.
So, while a large customer can have a direct and meaningful conversation with any vendor at any level of the organization, smaller customers still carry quite a bit of weight, especially when they are able to band together, or use their “word of mouth” power to communicate the positives and negatives of any vendor. There is tremendous leverage in the network of library management. One word of caution—be careful not to violate any confidentiality agreements you may have with your vendors.
As more products are produced for the library market, there will be even more pressure to justify spending. And there will be more pressure on vendors to provide more flexible models. Product acquisition, regardless of industry, is critical to the cost metrics of any organization. Libraries, being mission-driven, are not looked at as a revenue generator, yet they are essential to the mission of any organization they are part of. The proliferation of new products, both content and technology, in the library segment has made the job of negotiations more complex than ever before. A documented negotiation process, as opposed to a product review process, is an essential step in making any organization more effective in acquiring products and services. This doesn’t mean that decisions are made centrally, it simply means there is a checklist that must be covered: Are the objectives documented? Have all of the team members provided their feedback? Has the vendor documented deliverables if any promises are made? Are we meeting or exceeding our objectives? Have we created an equitable relationship with the vendor? It is easier to work through difficult negotiations with some understanding of the vendor’s cost structures, value proposition, vernacular, and motivations.
Matt Dunie is president and co-founder of LabArchives.
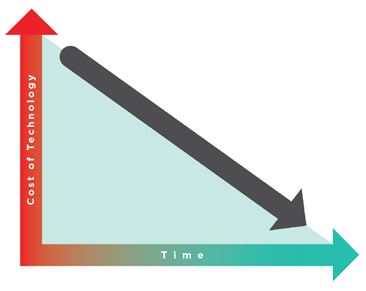
Figure 3.1
Basic cost of technology (to perform the same function) over time.
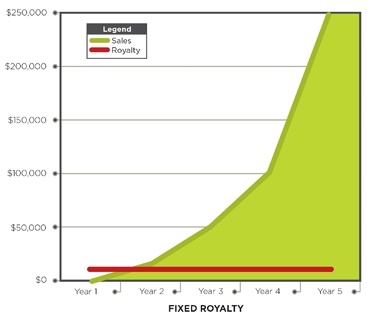
Figure 3.2
Fixed-price royalty.
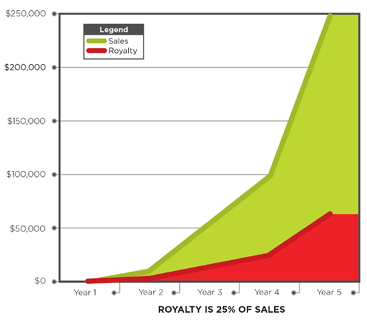
Figure 3.3
Royalty at 25 percent.
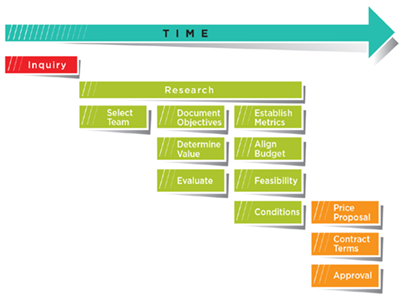
Figure 3.4
Negotiation timetable.
Table 3.1. Total Academic Library Expenditures
|
2008 |
2010 |
2012 |
|
|
Top 500 Academic Library Aggregate Total Expenditures |
4,981,437,070 |
5,003,854,991 |
5,143,780,237 |
|
Percentage Change Year to Year |
0.45% |
2.80% |
|
|
Percentage Change 2008–2012 |
3.26% |
||
|
Five-Year Inflation Rate |
9.3% |
Data-Planet by Conquest Systems, Inc. (2014). National Center for Education Statistics. Academic Library Statistics: United States: Total Expenditures | Country: USA – [Data-file]. Retrieved from www.data-planet.com, Dataset-ID: 017-015-024. doi:10.6068/DP1443140BCFA0.
Data-Planet by Conquest Systems, Inc. (2014). Bureau of Labor Statistics. Inflation rate: 3 Year | Country: USA | Consumer Item: All items – [Data-file]. Retrieved from www.data-planet.com, Dataset-ID: 002-010-002. doi:10.6068/DP144755AAEB314.
Table 3.2. Sample of High-Level Trends from Most Recent Three Academic Library Statistics Surveys
|
2008 |
2010 |
2012 |
|
|
Librarians & Professional Staff Count |
21,514 |
21,137 |
20,346 |
|
Total FTE Staff |
60,070 |
56,733 |
54,418 |
|
Expenditures for Preservation |
$37,335,518 |
$28,084,930 |
$24,155,598 |
Data-Planet by Conquest Systems, Inc. (2014). National Center for Education Statistics. Academic Library Statistics: United States: Expenditures for Preservation | Country: USA – [Data-file], Retrieved from www.data-planet.com. Dataset-ID: 017-015-019. doi:10.6068/DP144758AB8E816.
Data-Planet by Conquest Systems, Inc. (2014). National Center for Education Statistics. Academic Library Statistics: United States: Staff Count - Total FTE Staff | Country: USA – [Data-file], Retrieved from www.data-planet.com. Dataset-ID: 017-015-007. doi:10.6068/DP144332C8E6B80.
Data-Planet by Conquest Systems, Inc. (2014). National Center for Education Statistics. Academic Library Statistics: United States: Expenditures for Preservation | Country: USA – [Data-file], Retrieved from www.data-planet.com. Dataset-ID: 017-015-019. doi:10.6068/DP144332C9CDD81.
Table 3.3. Price Components and Cost Structure
|
Content Product |
Technology Product |
|
Editorial staff Content royalties Technology development/licenses If printed: paper, printing, binding Cost of sales, service, and support Cost of distribution (technology/shipping/distribution) General and administrative |
IT staff Technology licenses/royalties Project management Product management Marketing Cost of sales General and administrative |
Table 3.4. Annual Subscription—Example of Year-to-Year Budgeting
|
Yr 1 |
Yr 2 |
Yr 3 |
Yr 4 |
Yr 5 |
Yr 6 |
Yr 7 |
Yr 8 |
Yr 9 |
Yr 10 |
|
1,000 |
1,050 |
1,103 |
1,158 |
1,216 |
1,276 |
1,340 |
1,407 |
1,477 |
1,551 |
Table 3.5. Simple Subscription Product Pro-Forma
|
Annual Subscription |
Yr1 |
Yr 2 |
Yr 3 |
Yr 4 |
Yr 5 |
Yr 6 |
Yr 7 |
Yr 8 |
Yr 9 |
Yr 10 |
|
Selling Price |
1,000 |
1,050 |
1,103 |
1,158 |
1,216 |
1,276 |
1,340 |
1,407 |
1,477 |
1,551 |
|
Number of New Accounts |
50 |
150 |
150 |
150 |
150 |
150 |
150 |
150 |
150 |
150 |
|
Total New Sales |
50,000 |
105,000 |
110,250 |
115,763 |
121,551 |
127,628 |
134,010 |
140,710 |
147,746 |
155,133 |
|
Total Renew Sales |
47,250 |
148,838 |
156,279 |
164,093 |
172,298 |
180,913 |
189,959 |
199,456 |
209,429 |
|
|
Total Sales |
50,000 |
152,250 |
259,088 |
272,042 |
285,644 |
299,926 |
314,922 |
330,669 |
347,202 |
364,562 |
|
Cumulative Sales |
202,250 |
411,338 |
531,129 |
557,686 |
585,570 |
614,849 |
645,591 |
677,871 |
711,764 |
Table 3.6. One-Time Purchase
|
Purchase Maintenance |
Yr 1 |
Yr 2 |
Yr 3 |
Yr 4 |
Yr 5 |
Yr 6 |
Yr 7 |
Yr 8 |
Yr 9 |
Yr 10 |
|
Selling Price |
1,000 |
1,050 |
1,103 |
1,158 |
1,216 |
1,276 |
1,340 |
1,407 |
1,477 |
1,551 |
|
Number of New Accounts |
50 |
150 |
150 |
150 |
150 |
150 |
150 |
150 |
150 |
150 |
|
Total New Sales |
50,000 |
105,000 |
110,250 |
115,763 |
121,551 |
127,628 |
134,010 |
140,710 |
147,746 |
155,133 |
|
Total Renew Sales |
10,000 |
31,500 |
33,075 |
34,729 |
36,465 |
38,288 |
40,203 |
42,213 |
44,324 |
|
|
Total Sales |
50,000 |
115,000 |
141,750 |
148,838 |
156,279 |
164,093 |
172,298 |
180,913 |
189,959 |
199,456 |
|
Cumulative Sales |
165,000 |
256,750 |
290,588 |
305,117 |
320,373 |
336,391 |
353,211 |
370,871 |
389,415 |
Table 3.7. Customer Negotiation Objectives
|
Renewal rate |
Target renewal rate increase cap at 3%, accept 4% |
|
Rights to technology |
Adhere to organization policy of technology deposit in escrow managed by third party |
|
Ensure rights to third-party technology |
Legal clause stating rights, indemnification clause |
|
Provide periodic check on deliverables |
Document all development promises or provide financial or development mechanism for make-up in contract |
|
Maximize return on budget spend |
Quantify metrics associated with projected dollars to acquire product |
Table 3.8. Vendor Negotiation Objectives
|
Maximize revenue |
Initial price quote |
|
New product penetration |
Yes/No. Is this a new product to your organization |
|
Maintain operating margins |
Ask about operating margins, or research the company. May be harder to do, but with the information you have about cost structure, you can make assumptions |
|
Generate long-term revenue opportunities |
Renewal/maintenance/platform fees, long-term projection |
|
Establish/maintain positive brand |
Survey your team and users |