Chapter 4. Customizing Google Analytics for the Library Catalog or Discovery Service
Libraries invest in their online library catalogs and discovery services because they are websites designed to help users search and locate library resources. Adding Google Analytics to these online tools is not a new concept, but as they become more complex, it becomes more important to customize Google Analytics to collect the data needed to evaluate these platforms. This chapter discusses implementing Google Tag Manager (GTM) on a library catalog or discovery service and recommends a few other Google Analytics customizations for improved data collection.
Why Add Google Analytics to Library Catalogs and Discovery Services?
Many online library catalogs and discovery services come with their own internal usage tools that report types of searches and other useful data, so why bother adding Google Analytics at all? I never recommend adding Google Analytics on any website to simply replicate data you can already gather from another source. Instead, you should utilize Google Analytics to expand on that data. Google Analytics specializes in providing user behavior data (how users interact with a website) and offers sophisticated custom features to allow you to track the data you find valuable. Adding Google Analytics to a library catalog or discovery service should enhance those internal usage reports.
Implementing Google Tag Manager on a Library Catalog or Discovery Service
Chapter 2 of this issue of Library Technology Reports discusses the benefits of implementing GTM to any website. This section highlights installing the GTM container snippet on your online catalog or discovery service, which depends on the functionality of your system. Most online catalogs or discovery services have an administrative back end where you add the GTM container snippet to either a specific template web page or a setting option, but check your tool’s documentation for the best place to install GTM. For example, Innovative Interfaces’ Millennium and Sierra systems use a template-based system where you can add the GTM container snippet directly into the banner section of the catalog’s website using the toplogo.html template. Placing the GTM container snippet at the beginning of that template will inject the GTM container snippet in the ideal location—right after the opening of the body tag (<body>).
If your online catalog or discovery service has no direct access to the website’s code, you may have to be more creative on implementing GTM. For example, ProQuest’s Summon product has an administration console that manages the tool’s interface and settings. While Summon supports adding Google Analytics, it offers only a text box for the Google Analytics Tracking ID number within the administration console. Currently, there is no direct option to add the GTM container snippet. However, Summon allows you to add a single external script to your Summon site. You can use this option to load other scripts, including the GTM container snippet, to Summon. I used this option to add a script that loads the GTM container snippet right after the opening body tag on my library’s Summon website. While this solved how to install GTM on Summon, it introduced another issue—getting GTM to work on a dynamically generated site.
Google Tag Manager and Dynamically Generated Sites
Websites that use a script to dynamically generate content may not automatically work with GTM. Not sure how your catalog or discovery service loads content? Add the GTM container snippet to your catalog or discovery website. Next, create your Universal Analytics tag in your GTM container to sync your Google Analytics to your GTM container. Enter GTM’s Preview and Debug mode and open your catalog or discovery service website in the same web browser. If your Universal Analytics tag fires when you enter the site, but not when you go to a different web page, then your website is most likely dynamically loading content.
Don’t panic! Many web applications do not generate static web pages, and ProQuest’s Summon is an excellent example of a discovery service that dynamically loads content. A 2014 article discusses how Summon (version 2.0) uses AngularJS to dynamically generate its content and suggests how you can add your own script to customize its interface.1 The trick is to understand how the discovery service loads content so you can optimize GTM to track it. Summon does not load a new web page as users search or navigate through the system. Instead, it dynamically generates the content with each search, and it creates a new URL string (sometimes referred to as a new URL fragment) to mimic a new web page load. Simo Ahava recommends using GTM’s History Change trigger to track these URL fragments as virtual pageviews.2
Virtual pageviews got a bad reputation many years ago because they were used to track outbound links—those should be tracked as events to avoid pageview inflation in your Google Analytics reports! However, using virtual pageviews to track web pages makes perfect sense because it collects “pageview” data for dynamic website applications such as Summon. Virtual pageview data can be used in various Google Analytics reports making it the ideal solution.
Implementing the virtual pageview method in GTM is very easy as you just create a virtual pageview tag and a history change trigger.3 To do this, go into your GTM container, create a new tag, and
- Name the tag. I called mine Virtual Pageview.
- Select Google Analytics as the Product and add your Universal Analytics tracking code number.
- Select Page View for your Track Type.
- Expand the More Settings option. Under More Settings, expand Fields to Set and click the Add Field button. This area allows you to capture a different data point for Google Analytics’ Page metric.
- In the Field Name text box, you must add a metric or dimension that Google Analytics can recognize. In this case, type in the word page. Page is Google Analytics metric for a web page’s URL.
- In the Value text box, add {{New History Fragment}}, which is the GTM system variable to capture the URL fragment. If you do not see {{New History Fragment}} as an option, you will need to enable it in the GTM Variables area. This tells GTM to collect the URL fragment as Google Analytics’ Page metric.
- Click the Continue button to add a trigger.
- Under the Fire On options, choose More.
- Click the New button to create a new trigger.
- Select the History Change option.
- Under the Fire On options, select the Some History Change option.
- Since you want this tag to fire only when the URL fragment changes, you should configure the trigger to fire when the History Source matches RegEx popstate|hashchange. This configuration allows the History Source to be either set as popstate, which is recognized by most modern web browsers, or hashchange, which is used for Internet Explorer browsers.4
- Name and save the trigger to automatically add it to your tag.
- Save your virtual pageview tag (figure 4.1).
Test the changes to your GTM container in the Preview and Debug Mode and in Google Analytics Real-Time reports to ensure the tag captures the correct data and then publish your container. This tag will fire only when the URL fragment changes in Summon, so it does not track every single “pageview.” For example, this tag will not collect the session’s first pageview because no change history event takes place when the user enters the website. A regular GTM Google Analytics tag will capture that data.
Events to Track for Your Catalog or Discovery Service
Using GTM on your catalog or discovery service simplifies how you track Google Analytics events.5 There are many actions you can track as events on online catalogs or discovery services including:
- Outbound links—Probably the most useful event because it shows when users connect to content outside of the catalog or discovery service, such as clicking on a link to an e-book.
- Zero search results—This event tracks when users get no results in their search. You can see how often it happens and what users do from there.
- Search facets or limiters—Use an event to track which search facets are more likely to get used.
- Request or hold buttons—You can track when users click on specific buttons (or links) as events.
- Additional features—You can set up event tracking for any script-based feature such as chat widgets, text/sms exports, citation generators, e-mail options, permalink creator, browsing shelf widget, and whatever else your catalog or discovery layer contains.
If you feel overwhelmed with all the potential events to track, start with tracking the events that are critical in measuring the success of your online catalog or discovery service. In my library, we consider outbound links to library resources (e-books, streaming videos, or other online content) as one measure for a successful search, but we also consider requests to hold a specific physical item as another indicator. The previous chapters of this issue of Library Technology Reports discussed configuring an outbound link event tag and zero search results event tag in GTM. This section will focus on creating an event tag for tracking the clicks on a request or hold button.
Request a Hold Event in III’s Sierra
Similar to any library catalog or discovery service, placing a hold on an item in Innovative Interfaces’ (III) Sierra online catalog requires the searcher to locate the item in the catalog, click on a request/hold button (or link) for that item, and log into their patron account to associate the request with a user account. The Request a Hold GTM event tag that I propose tracks when a user clicks on the request button in my library’s online catalog to start the request process. Here are the steps:
- In your GTM container, create a new tag and name it. I named mine Request a Hold event.
- Select Google Analytics as the Product and add your Universal Analytics tracking code ID number.
- Under Track Type, select Event.
- Add your event category, action, and label. I named mine:
- category: Request a Hold
- action: submit
- label: {{Click URL}} (GTM system variable that records the URL of the request button)
- Under the Fire On options, select the Click option to create a click trigger and name that new trigger. I named mine Request Hold Trigger. See figure 4.2.
- Select Just Links for Targets, and deselect Wait for Tags and Check Validation, which are useful for testing tags but can also slow down web page response time.
- Select Some Links.
- Enter the unique identifiers for that request button. In my library’s catalog, we have two locations for hold buttons: item record and in the search results. Each button functions the same but has a slightly different link, so I created a RegEx statement to include both options based on a unique element in their URL.6 My FireOn statement looks like this: Click URL matches RegEx \/request (figure 4.2).
- Save the new trigger and save the event tag.
Test your new tag and publish the changes in a new GTM container version. Your new event data will start populating the Google Analytics Event reports within twelve to twenty-four hours. These reports show the total number of request hold events started, where users found that request button, and the items users are interested in requesting.
Enhancing Google Analytics Data for the Catalog or Discovery Service
Within your Google Analytics account, there are a few additional features such as site search, content groups, and conversions you should configure to improve Google Analytics’ ability to provide you with great data. You must be an administrator for your Google Analytics account to enable these options.
Site Search
The online catalog or discovery service is designed to help users to search for something. Google Analytics’ Site Search tracks when users search your catalog or discovery service website and provides additional user search data not typically included in those internal search reports.7 Chapter 3 of this issue of Library Technology Reports demonstrates how to enable Site Search, so apply those methods to your catalog/discovery service.
Content Groups
If you already use Google Analytics to track your library catalog or discovery service, you may feel overwhelmed with the Site Content reports because they show every single web page a user views while searching. It is a massive amount of data and difficult to analyze. To manage the chaos, you can use Google Analytics’ Content Grouping feature to identify a set of web pages and organize them as a group.8 This does not impact how the data is collected, but rather organizes your web pages into useful categories for further analysis. For catalogs and discovery services, Content Grouping can sort web pages into categories such as search types or result pages versus item-level pages. Each Google Analytics’ View is limited to five content groupings, but each content group can have as many categories as desired. Also note that groups cannot be deleted in Google Analytics. They can only be turned on and off, so be strategic in how you use them.
In this example, I will create a new content group for the different search types in my library catalog. This data is displayed in the content group report, providing you with more comprehensive search type data.
To create a search type content group, go to the Content Grouping section under the View information in Google Analytics’ Admin interface and follow these steps:
- Click on the New Content Grouping button and name your content group. My example is called Search Types.
- Click on the Create New Rule Set button. You can group your content using three methods: tracking code, extraction, and rule definitions. I recommend rule definitions because you can identify the desired web pages by their URLs.
- Name the rule.
- Define the rules by using elements in the URL, such as the search category parameter unique to that specific search. For example, web pages for keyword searches in my library catalog contain X?SEARCH or searchtype=X in their URLs. I used those two URL strings to identify keyword related searches as shown in figure 4.3.
- Click the Done button and repeat steps 2 through 4 for each different search type you want to group. Overall, I created four definitions for my catalog’s primary search types: keyword, title, author, and subject. However, you could include any search type your catalog allows.
- Once you are done adding the search types, save the Content Group.
It takes about twelve to twenty-four hours for the content grouping data to appear in the Google Analytics Content Reports. Once it is available, go to the All Pages report and select the content group as the primary dimension to display the data.
Conversions
Conversions are an essential Google Analytics metric for measuring the success of any online tool.9 Library catalogs and discovery services tend to have a similar main purpose: connect users to library resources. How do you measure this? Most likely using those useful events to track various user actions! My library uses specific events such as electronic resource outbound links, holds on physical items, and even exporting information via e-mail or a citation tool as indicators for a successful search. All of these actions are tracked using GTM event tags for both our catalog and discovery service, so it was easy to create an event type goal (conversion). Need help configuring conversions? The first chapter of this issue of Library Technology Reports talks about Google Analytics conversions and goals.
Conclusion
Google Analytics provides a wealth of additional usage data for any catalog or discovery service website, but it depends on how much time you invest to optimize Google Analytics’ ability to track these tools. Not only do you need to know what data you want to track, but you should have a good understanding of how your catalog or discovery service website displays content. With this knowledge you can leverage Google Analytics to collect the data you need.
Notes
- Godmar Back and Annette Bailey, “Hacking Summon 2.0 the Elegant Way,” Code4Lib Journal, no. 26 (2014), http://journal.code4lib.org/articles/10018.
- Simo Ahava, “#GTMtips: Track URL Fragments as Pageviews,” Simo Ahava’s Blog, October 3, 2015, www.simoahava.com/gtm-tips/track-url-fragments-as-pageviews.
- “History Change,” Google Tag Manager, accessed February 29, 2016, https://support.google.com/tagmanager/answer/6106961#HistoryChange.
- “Popstate,” Mozilla Developer Network, accessed March 17, 2016, https://developer.mozilla.org/en-US/docs/Web/Events/popstate; “Hashchange,” Mozilla Developer Network, accessed March 17, 2016, https://developer.mozilla.org/en-US/docs/Web/Events/hashchange.
- “About Events,” Google Analytics Help, accessed February 29, 2016, https://support.google.com/analytics/answer/1033068?hl=en.
- LunaMetrics, “About Regular Expressions,” Google Analytics Help, last updated March 8, 2008, https://support.google.com/analytics/answer/1034324?hl=en.
- “Set Up Site Search,” Google Analytics Help, accessed February 29, 2016, https://support.google.com/analytics/answer/1012264?hl=en.
- “About Content Grouping,” Google Analytics Help, accessed March 5, 2016, https://support.google.com/analytics/answer/2853423?hl=en.
- “Create, Edit, and Share Goals,” Google Analytics Help, accessed March 17, 2016, https://support.google.com/analytics/answer/1032415?hl=en.
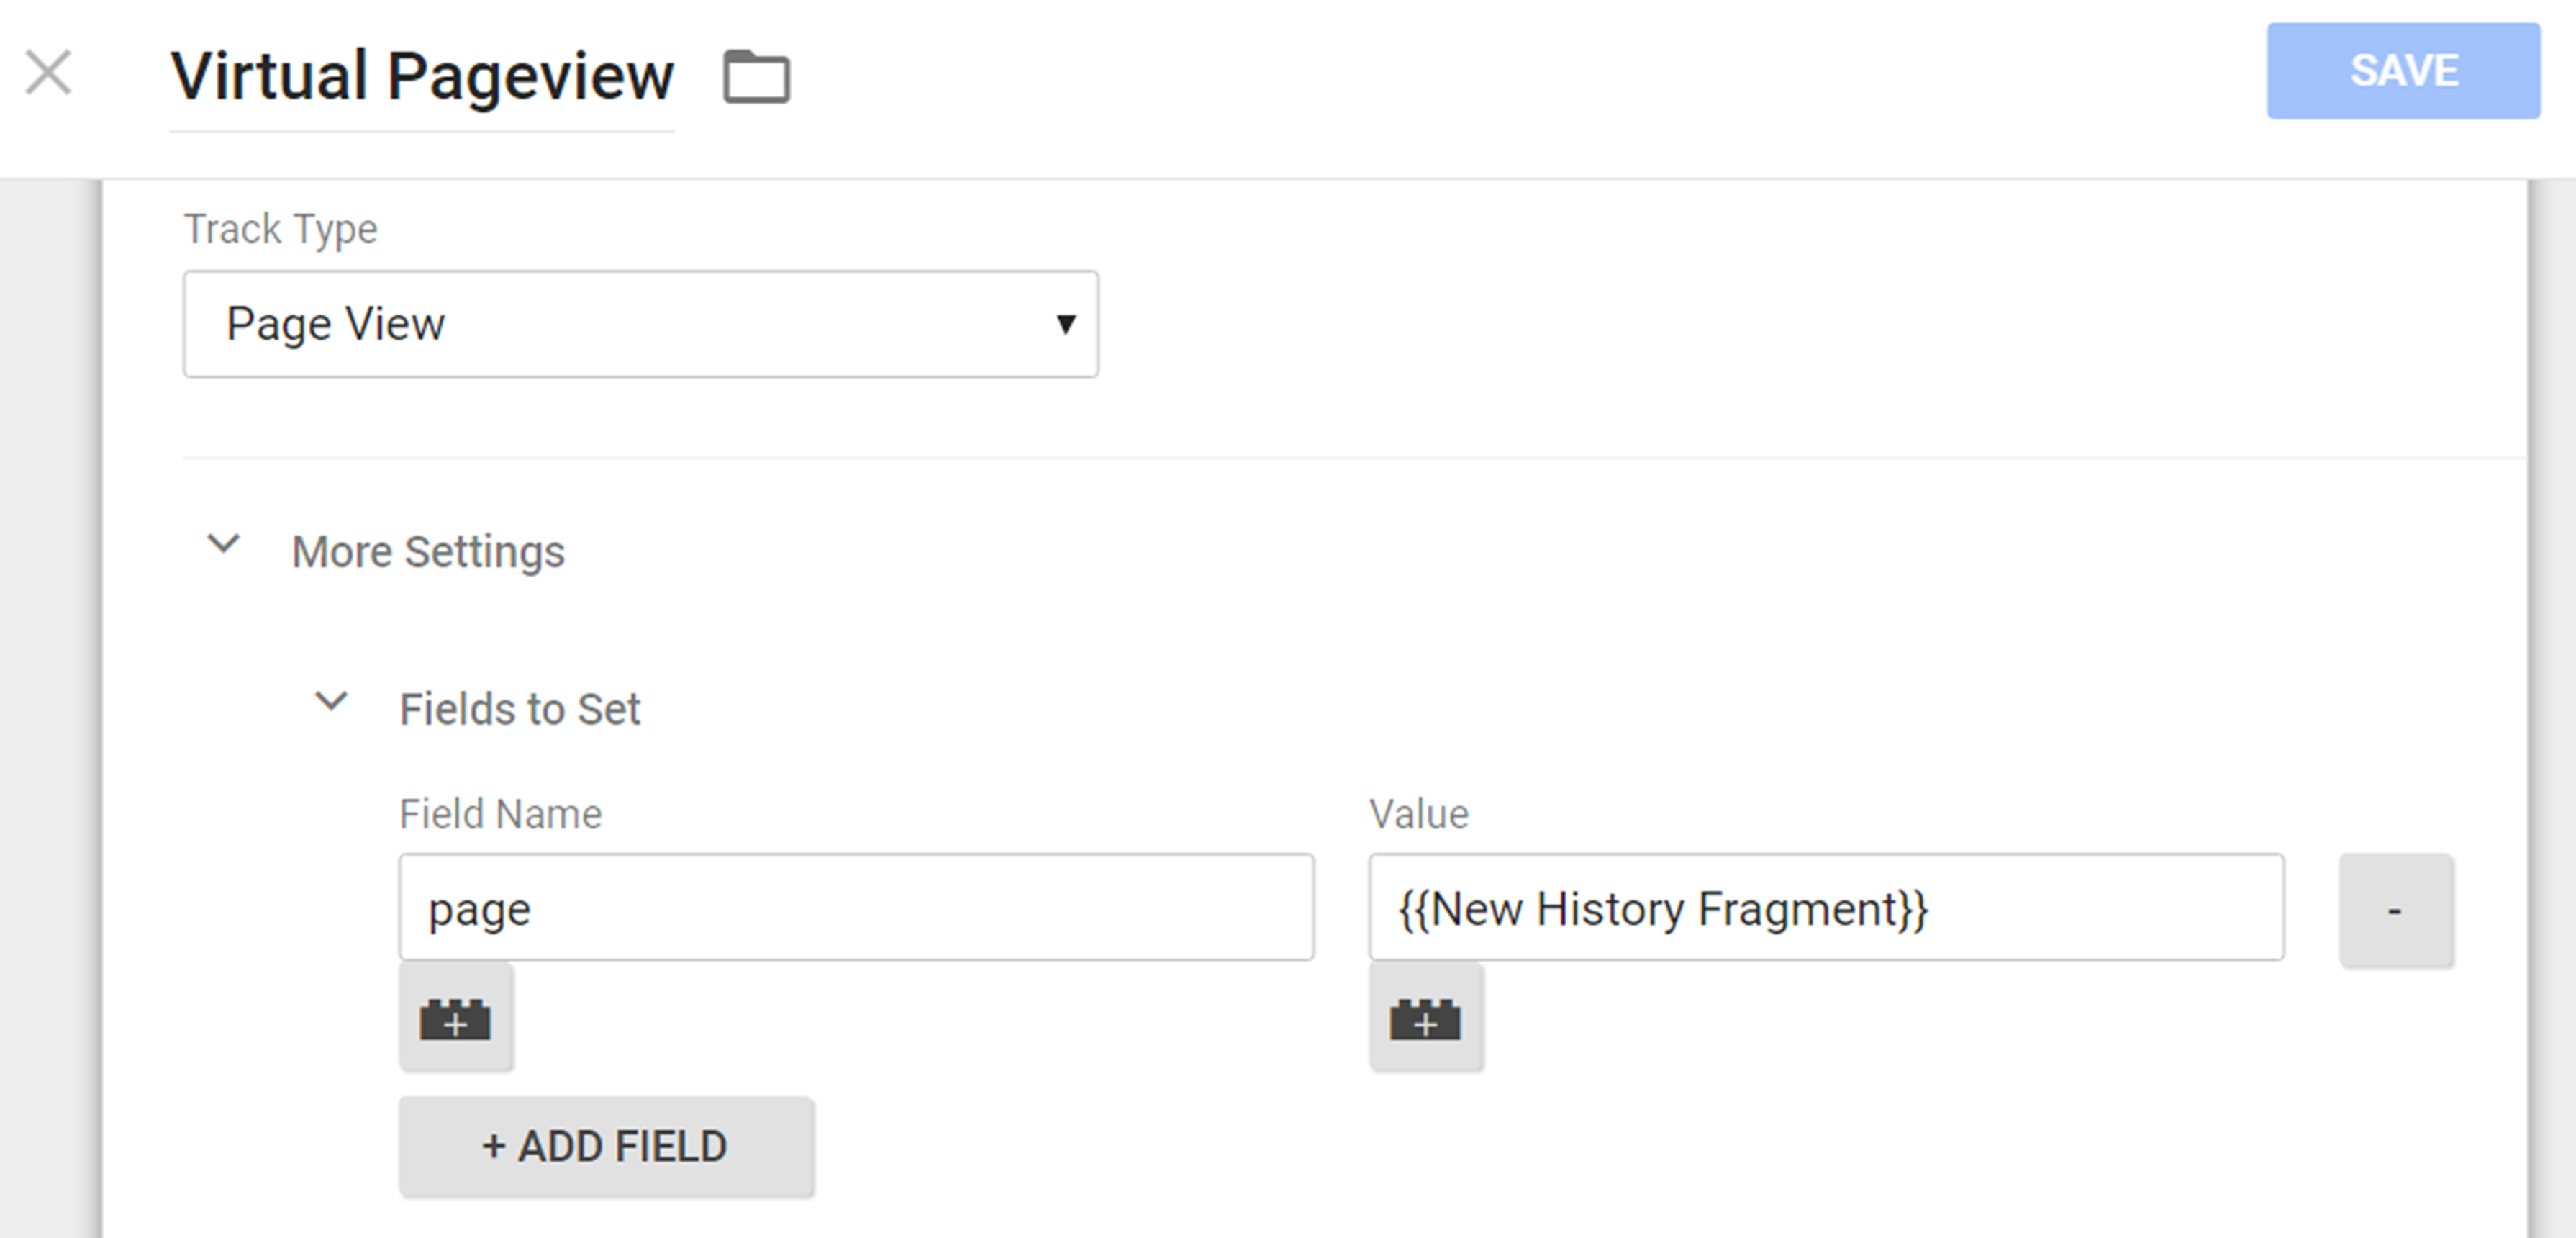
Figure 4.1
Virtual pageview tag, Google Tag Manager, University of Colorado Colorado Springs
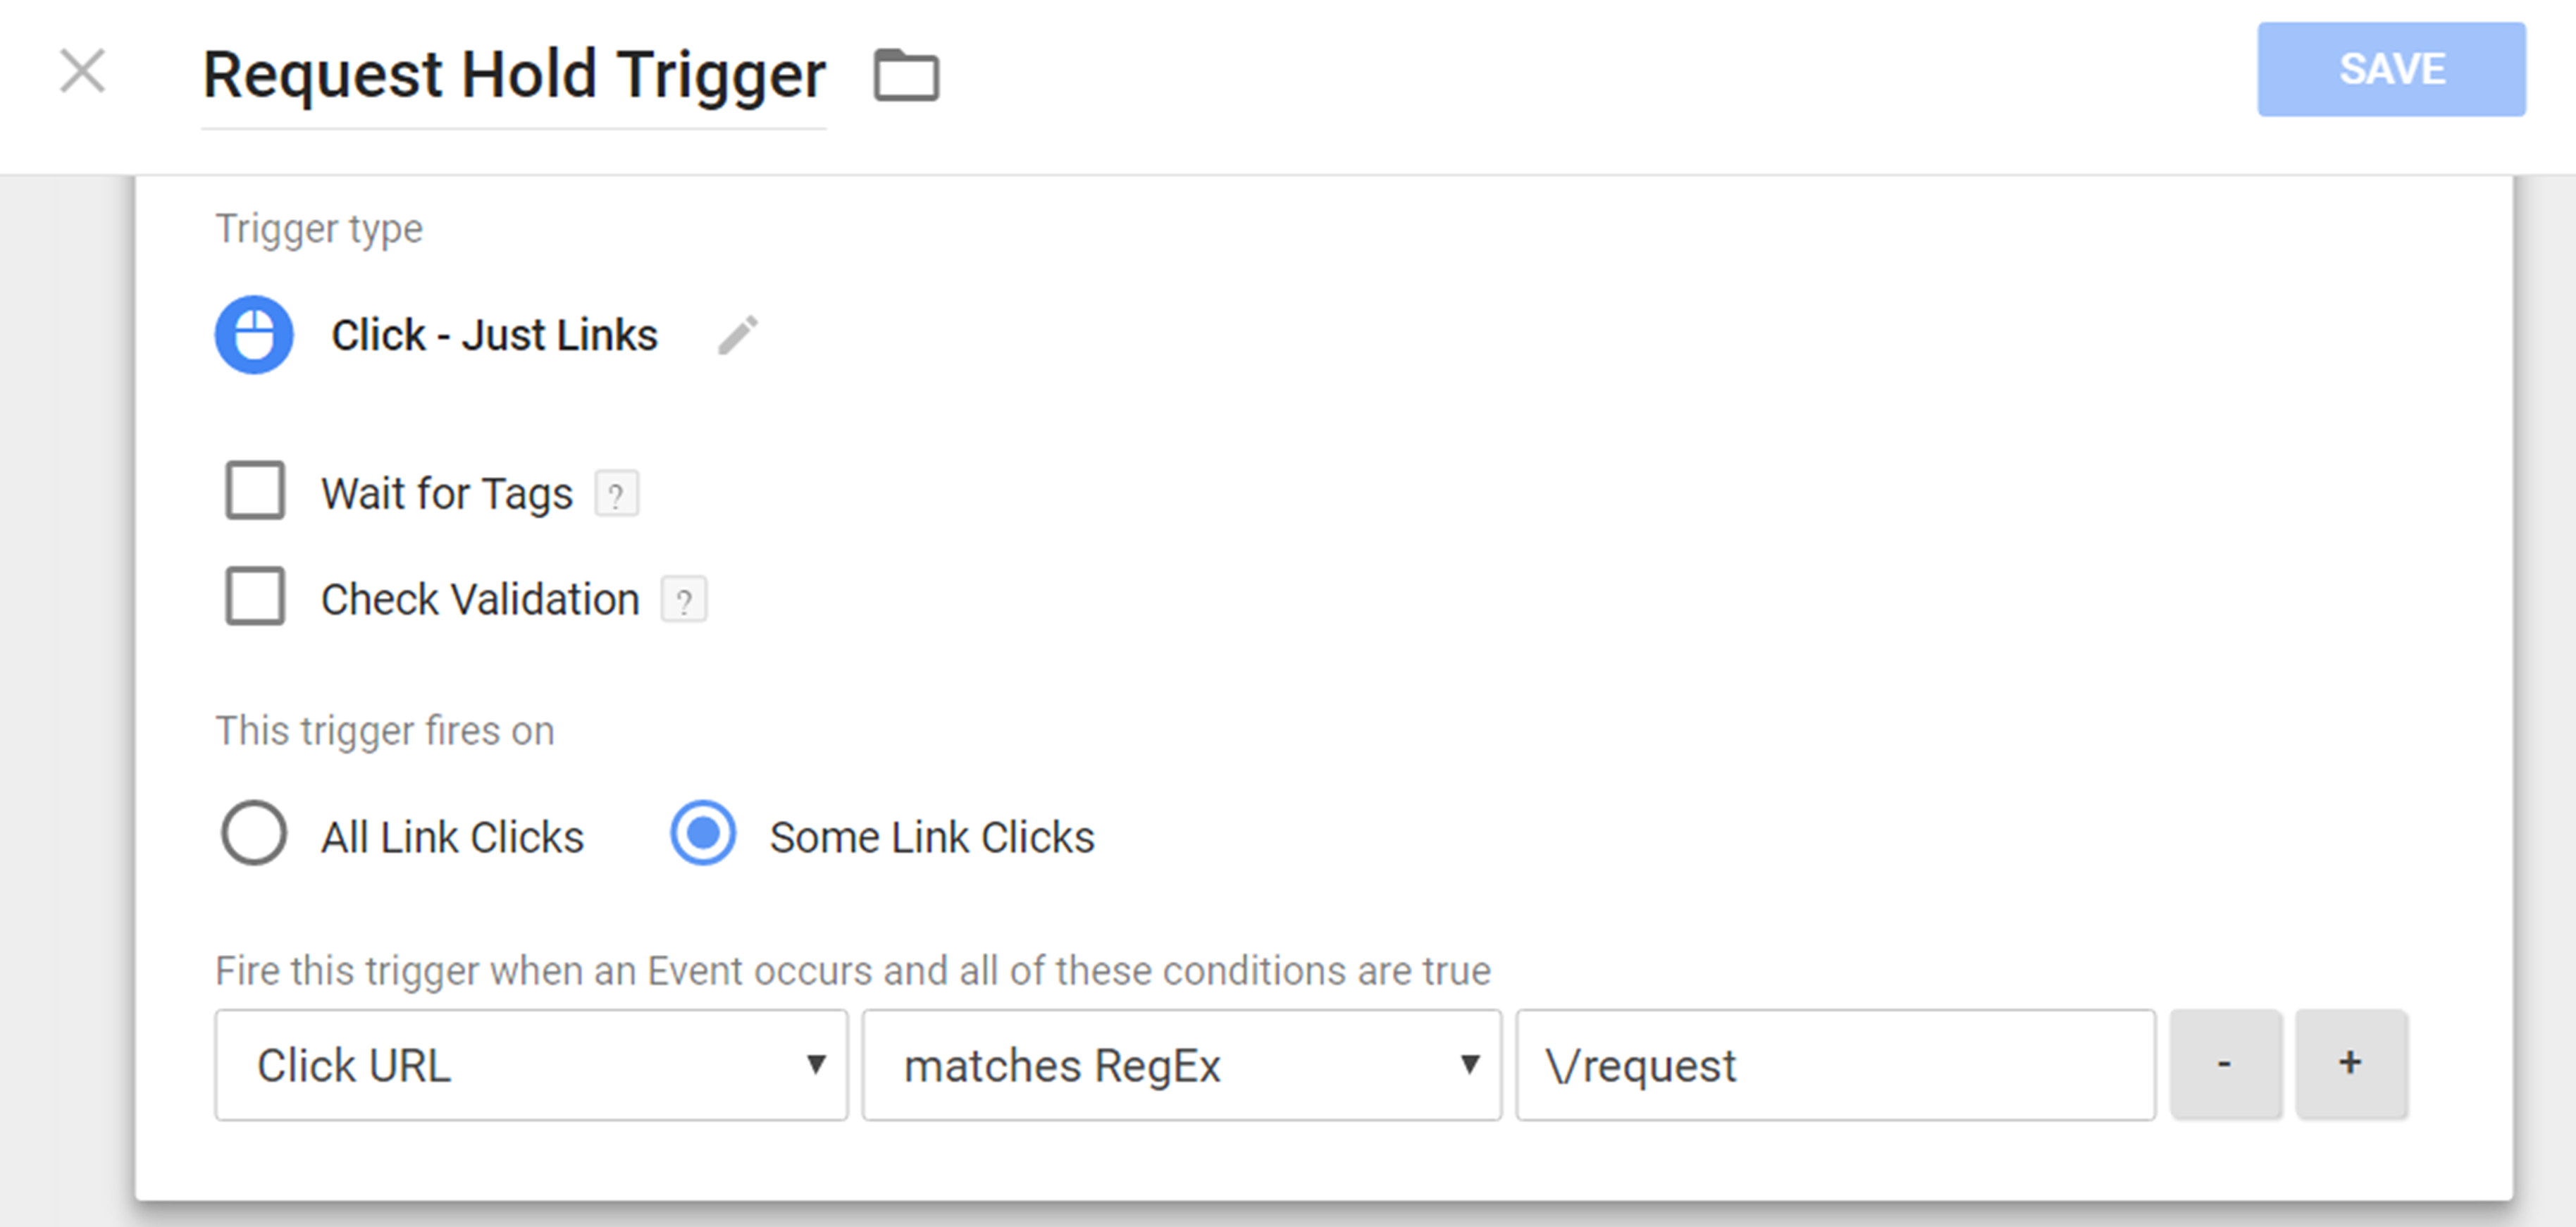
Figure 4.2
Request hold trigger, Google Tag Manager, University of Colorado Colorado Springs
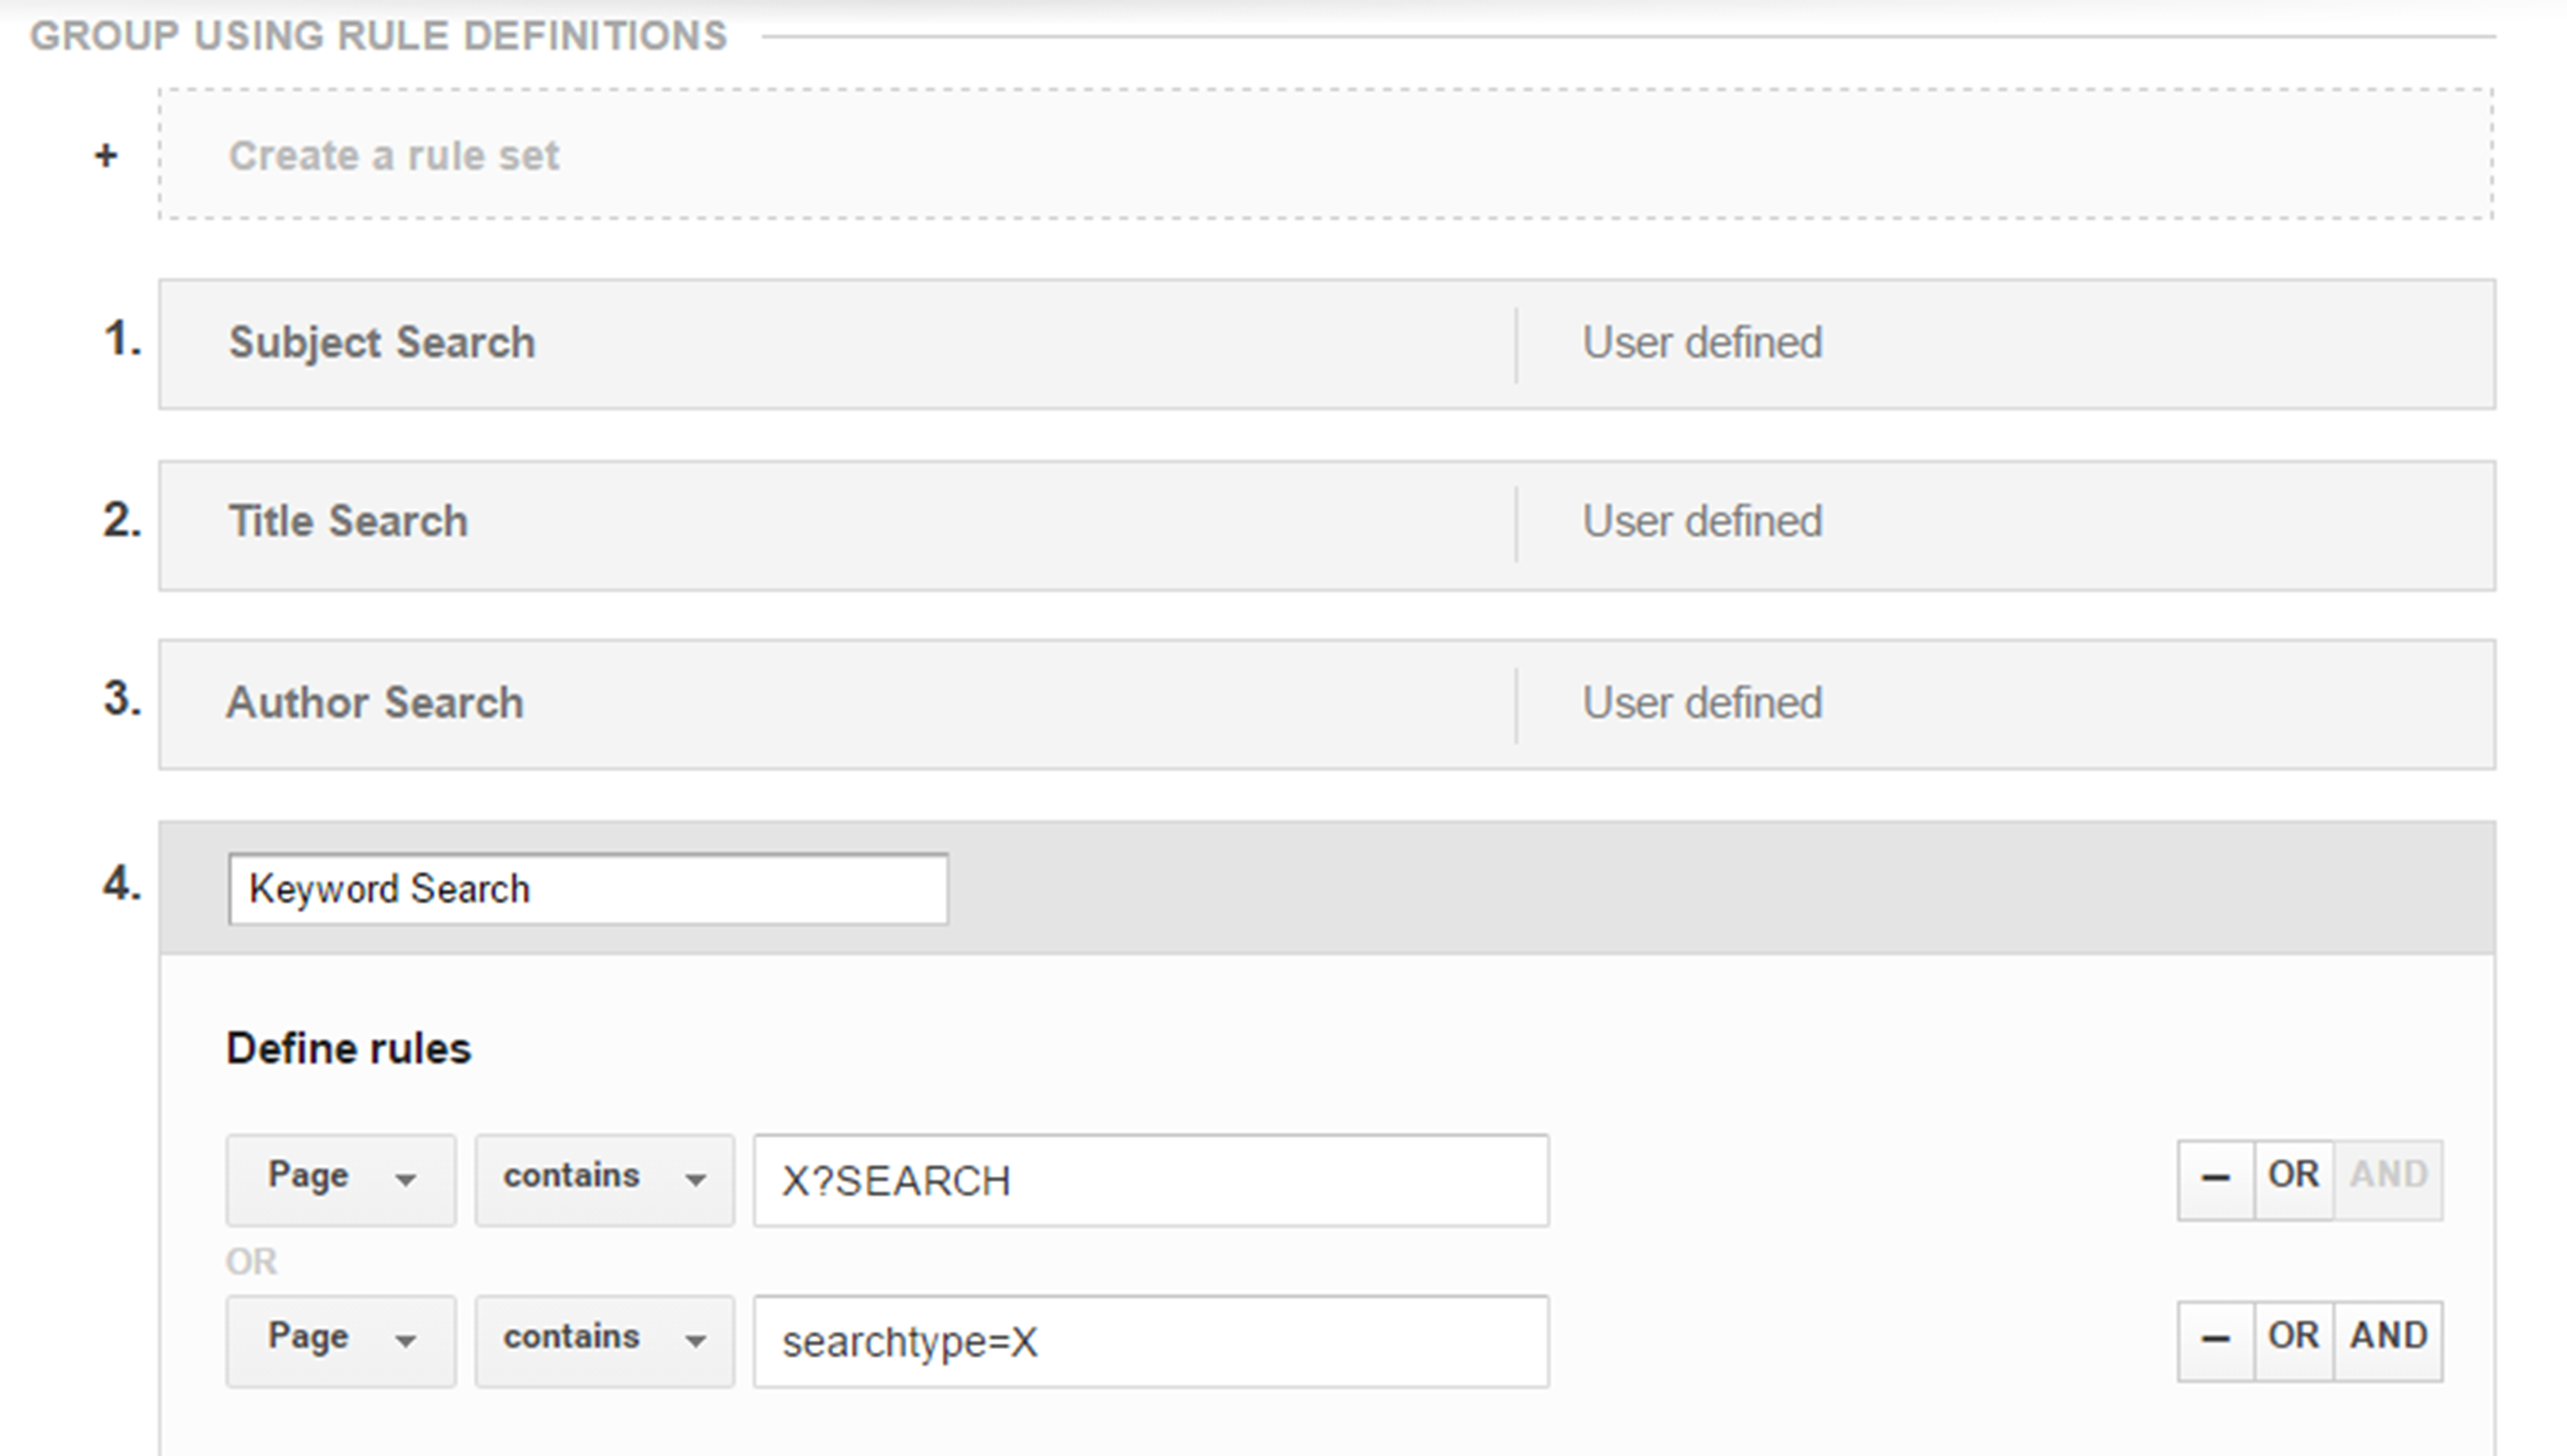
Figure 4.3
Keyword content group configurations, Google Tag Manager, University of Colorado Colorado Springs