Chapter 5. Optimizing Google Analytics for LibGuides
Springshare’s LibGuides system is a popular solution for libraries to empower content creators to publish online guides for classes, disciplines or subjects, and other various help topics. Although LibGuides makes it easier to create guides, that does not automatically imply it is easier for the end user to find information. You should assess the use of these guides like any other library website. Adding Google Analytics to your LibGuides provides robust user metrics so that you can better understand guide usage, but it is not without its challenges. This chapter discusses your options for installing Google Analytics on LibGuides and how it impacts assessing data at the individual guide level.
Why Install Google Analytics Anyway?
The standalone LibGuides (version 2) platform has an internal statistics tool within its editor/admin interface that provides basic usage statistics such as pageviews and clicks on certain link types (assets only) at the guide level. The LibGuides CMS platform provides additional metrics for sessions, web browsers, and searches for the entire website. What’s missing in the internal LibGuides statistics tool? Basic user engagement metrics, including number of users (versus number of pageviews), time on guide, pageviews per session, and so much more. It also misses how users navigate through your guide and user retention data—do your guide users return to use this guide or use other guides? Additionally, you can track user actions on elements beyond what LibGuides defines as assets.1 These data points provide a more complete picture of what users do on your guides.
Adding Google Tag Manager to LibGuides
Springshare provides documentation on how to install Google Analytics on various Springshare platforms, including LibGuides. Adding Google Analytics is an admin feature, so if you are a guide editor without admin-level permissions, you will have to work with your LibGuides’ admin for this process. However, adding Google Analytics is only a two-step process:
- Create the Google Analytics account and generate the tracking code.
- Add the Google Analytics tracking code to the Custom Analytics tab in the Systems Setting area under the Admin menu.
This method works if you want just to add the Google Analytics tracking code, but if you want to use Google Tag Manager (GTM) to add your Google Analytics, there are a few more considerations. The GTM container snippet is designed to be added right after the opening body tag (<body>), but the Custom Analytics tab renders that code in either the head tag (<head>) section or right before the closing of the body tag. This option works, but you run the risk of missing some data.2
For the data purists that want to maximize GTM’s ability to collect data, another option is to add the GTM container snippet to the individual Page Layout Templates found under the Look & Feel section in the Admin area. LibGuides has six web page template types (Guide, Homepage, Search, Subject, Profile, and A–Z) that control how each of those pages display. You can add the GTM container snippet right after the body tag in each of these templates.
Useful Events to Track with Google Tag Manager
Event tracking with GTM is introduced in chapter 2 of this issue of Library Technology Reports, so this section suggests specific events to track for a LibGuides website such as:
- outbound links
- e-mail links
- document downloads
- tabbed boxes
- search widgets
- multimedia widgets
This is not a comprehensive list, but it accounts for most LibGuides features you can track with GTM event tags. Outbound link event tags are discussed in chapter 2 of this issue of Library Technology Reports, and document downloads will be covered in chapter 6. This chapter will describe how to track the use of tabbed boxes and suggest an easy way to track embedded YouTube videos.
Tabbed Boxes
Tabbed boxes is a LibGuides (version 2) feature that allows content creators to create multiple “pages” of content in one box. This is great for the content creators that love to fill their guides with a lot of content, but it raises the question: do users find and use the content hidden in those tabbed boxes? Tabbed boxes can be tracked as an event to answer that question. This requires a new GTM tag and trigger to track clicks on the tabs. Log into your GTM container and
- In the Tag section, click on the New button to create the new tag.
- Name your new tag. For this example, I called it the Tabbed Box Event Tag.
- Add your Universal Analytics tracking ID number and select Event as your track type.
- Add the category, action, and label information. In this example, I use
- category: Tabbed Box
- action: view
- label: {{Click Text}} (GTM system variable)
- For the tag firing options, select Once Per Event to track the click on the tab.
- Under the Fire On section, choose the Click option to create a new click trigger for this tag so that it fires only when users click on a tab in a tabbed box.
- Give the new trigger a name. I called mine Tabbed Box Trigger.
- Select Just Links since the tabs are links.
- In the Fire On section, select {{Click URL}}, which is a GTM system variable that collects the URL of the link being clicked. Next, select Contains from the dropdown options and then add #s-lib-ctab- into the text box. Why #s-lib-ctab-? Currently all LibGuides tab links use a similar text string (#s-lib-ctab-) in their anchored links, so this was the easiest way to identify just those tab links.
- Click the Save Trigger button to go back to your Tabbed Box Event Tag.
- Click the Save Tag button.
Google Tag Manager
http://tagmanager.google.com/?hl=en
Test your new event tag using the GTM Preview and Debug option. If your tag fires as planned, publish the changes to your GTM container to complete the process.
Embedded Media Widgets
Embedded media widgets can be onerous to track as events in GTM because guide editors can use several services, such as YouTube, Vimeo, SoundCloud, or your library’s streaming server, to grab media content to embed in their guides. Currently there is not one seamless method to track all embedded media services in GTM. Instead, you need to understand how the media is embedded and determine how to best capture that data in GTM.
Fortunately, the major media providers are widely supported in GTM. For example, there are many solutions to implement event tracking on YouTube videos. LunaMetrics has a useful plugin you can add to your GTM container to automatically generate the necessary user-defined variables, triggers, and tags that enables event tracking on YouTube videos on your website.3 No additional coding is required on your LibGuides website—just add your Google Analytics ID number to one of the newly created event tags and published your GTM container. It is an easy and robust solution for libraries to adopt.
For libraries that still want to create their own GTM event tags to track YouTube videos, the Cardinal Path website also has a step-by-step guide to walk you through the process.4 This is ideal for anyone who wants to learn how GTM actually functions, and it will give you an idea of how to track different embedded widgets from other media providers.
Potential Problems
All of these events rely on knowing the specific code used to identify these events. If this code ever changes (which it most definitely will as Springshare further develops the LibGuides platform), these event tags will break in GTM. Consider setting an alert in your Google Analytics account to help you monitor your event data. You can set Google Analytics to send you an e-mail notification if an event reports zero data over a specific amount of time. From there, you can test the GTM event tag to determine if it is the event is still firing.
Guide-Level Reports in Google Analytics
Once you configure GTM to track the useful events, the next step is to configure Google Analytics to provide you and all those guide editors with the data. Since guide editors will be interested in data from their individual guides, you must examine the data at the guide level, which requires additional configurations in Google Analytics.
Creating Guide-Level Reports with Custom Segments and Inline Filters
Producing a guide-level report in Google Analytics involves analyzing data from a specific group of web pages for an individual guide. Google Analytics’ segments and inline filters hide the unwanted data in a report so you can drill down to web pages just from a specific guide. Segmenting is the ability to temporarily remove data in individual reports within Google Analytics. Every Google Analytics account contains system-generated segments and also allows you to create your own custom segments, which are saved in your user account so they can be applied to most reports at any time. Inline filters are temporary filters that can be found within various Google Analytics reports.5 Unlike segments, inline filters cannot be saved, so they are used mainly to quickly sift through report data as necessary.
Creating a guide-level report within Google Analytics is a two-step process. I recommend first creating a custom segment using the Page Title dimension to remove “internal” usage data and then using the inline filter option to find a specific guide name. I will demonstrate this process by creating a guide-level report in Google Analytics All Pages report.
First, let’s create the custom segment to remove any session data from guide editors or administrators that are logged into the LibGuides system so we can focus on actual guide user data. Since this is a feature you will use a lot, it is much more time-effective if you create the custom segment once and apply it as necessary. You can identify users logged into the LibGuides system by looking at Google Analytics’ Page Title dimension, which reports the content in the title tag (<title>) of the web page. When a guide editor or administrator is logged into the LibGuides system, all guide-related web pages will start with the words Edit or Preview in their title tags. This makes it easy to identify those internal use pages. To create this custom segment, follow these steps:
- Click on Add Segment option close to the top of most reports.
- Click the new segment button and name the segment.
- Select Conditions under the Advanced options.
- Select Sessions and then Exclude, which removes selected data. Next, select Page Title and the Matches RegEx option and add a RegEx snippet that looks like ^(EDIT|PREVIEW) as shown in figure 5.1.6
- Save the new custom segment.
Next, go to the All Pages report under the Site Content reports in Google Analytics’ Behavior section. The All Pages report shows all web pages that have been viewed on a website and their basic usage metrics such as number of pageviews and average time users spent on the page. By default, this report displays web pages by their URLs (Google Analytics’ Page dimension). This is not the optimal way to view LibGuides’ web pages because a single guide web page could have two or more associated URLs due to LibGuides’ friendly URL feature. For example, when you create a guide page in LibGuides, that page is automatically assigned a system-generated URL (like http://libguides.uccs.edu/c.php?g=223497&p=1480509), and the guide editor can opt to give that same page a friendly URL (such as http://libguides.uccs.edu/cite). Both links takes users to the same web page, but one URL is much easier to read. Since there are two URLs assigned to that web page, Google Analytics treats this single web page as two separate web pages if you analyze data with the Page dimension. Switching the All Pages report’s primary dimension to the Page Title dimension fixes this issue because each guide web page has one title tag to identify it.
Now that the All Pages report is using the Page Title dimension, you can apply your new custom segment to remove that internal session data if you have not already done so.
Since LibGuides uses the guide’s name as the start of the title tag, the final step is to use an inline filter to search for a specific guide name to create a guide-level report. With the Page Title set as the primary dimension in the All Pages report, you can just add the guide name to the inline filter box and click the search button to quickly filter to that guide’s web pages.
Is using the Page Title dimension perfect? Absolutely not, because it relies on the title tag never changing. When a guide editor renames a guide, it creates a new title tag and generates a separate Page Title in Google Analytics reports, making it difficult to compare guide usage over extensive periods of time. This is unavoidable due to the nature of Google Analytics and LibGuides. Currently, there is not an easy solution for this problem, but it is better to understand this “flaw” to best accommodate it rather than not collecting the data at all.
Getting the Guide-Level Reports to Guide Editors
If you found the process of creating a guide-level report difficult or just too time-consuming, imagine how your guide creators would feel having to go into Google Analytics to create these reports themselves. They most likely would not even bother with the process.
So how do you get all of this useful data to the people that need it without forcing them to use Google Analytics? Google Analytics has a few options, including exporting the reports or using the Google Analytics API to build your own statistics tool. Exporting the reports requires you to create scheduled e-mail exports of the guide-level report that are sent to the guide editors.7 This process is time-intensive for you to set up and can still be confusing to the guide editors because they still need to interpret what the data means—this is actually the hardest process in web analytics.
The other option is to use the Google Analytics API to create a custom analytics dashboard for your guide editors to access (figure 5.2).8 This takes time to design and build but creates a great opportunity to discuss the data options and features with guide editors to ensure you design reports that are usable and useful in their decision-making process.
Conclusion
Adding Google Analytics to your LibGuides website requires planning and additional configurations to get the most out of the user data. However, it is well worth the extra time because Google Analytics provides more in-depth usage data and reports that reveal how users are interacting with these online guides. Sharing this useful information with guide editors is essential to improve their ability to make more user-friendly guides.
Notes
- “Introduction to LibGuides: Your Assets,” Boston College University Libraries, accessed March 17, 2016, http://libguides.bc.edu/libguidesintro/yourassets.
- Justin Boyle, “Where Should the Google Tag Manager Snippet be Placed?” LunaMetrics, December 12, 2014, www.lunametrics.com/blog/2014/12/12/google-tag-manager-snippet-placement.
- “LunaMetrics YouTube Google Analytics Embed Tracking,” GitHub, accessed March 3, 2016, https://github.com/lunametrics/youtube-google-analytics.
- Nicky Yuen, “YouTube Video Tracking with Google Tag Manager (V2) and Universal Analytics: A Step-by-Step Guide,” Cardinal Path, May 26, 2015, www.cardinalpath.com/youtube-video-tracking-with-google-tag-manager-v2-and-universal-analytics-a-step-by-step-guide.
- Doracs Alexander, “Google Analytics Filters: Don’t You Forget about Me,” LunaMetrics, August 26, 2013, www.lunametrics.com/blog/2013/08/26/dont-forget-ga-filters.
- Robin Steif, Regular Expressions for Google Analytics (Pittsburgh, PA: LunaMetrics, 2010), www.lunametrics.com/regex-book/Regular-Expressions-Google-Analytics.pdf.
- “Export and Email Reports,” Google Analytics Help, accessed March 5, 2016, https://support.google.com/analytics/answer/1038573?hl=en.
- “Google Analytics,” Google Developers, accessed March 17, 2016, https://developers.google.com/analytics.
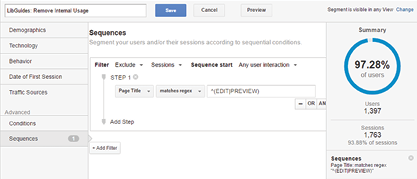
Figure 5.1
Custom segment, Google Analytics, University of Colorado Colorado Springs

Figure 5.2
LibGuides usage tool that uses the Google Analytics API, University of Colorado Colorado Springs